Alpha Discovery · Decision Framework
#1 How to Find High-Conviction Stock Entries Using Single-Stock Deep Dive
· 8 min read

Live Single-Stock Deep Dive analysis showing stock metrics and decision framework.
📍 Home › ANALYSIS_1 › Single-Stock Deep Dive
0) Where to Find This Widget
From the main mobile dashboard (12 tiles), open ANALYSIS_1. The Single-Stock Deep Dive widget is the first block on that page (Alpha Discovery).
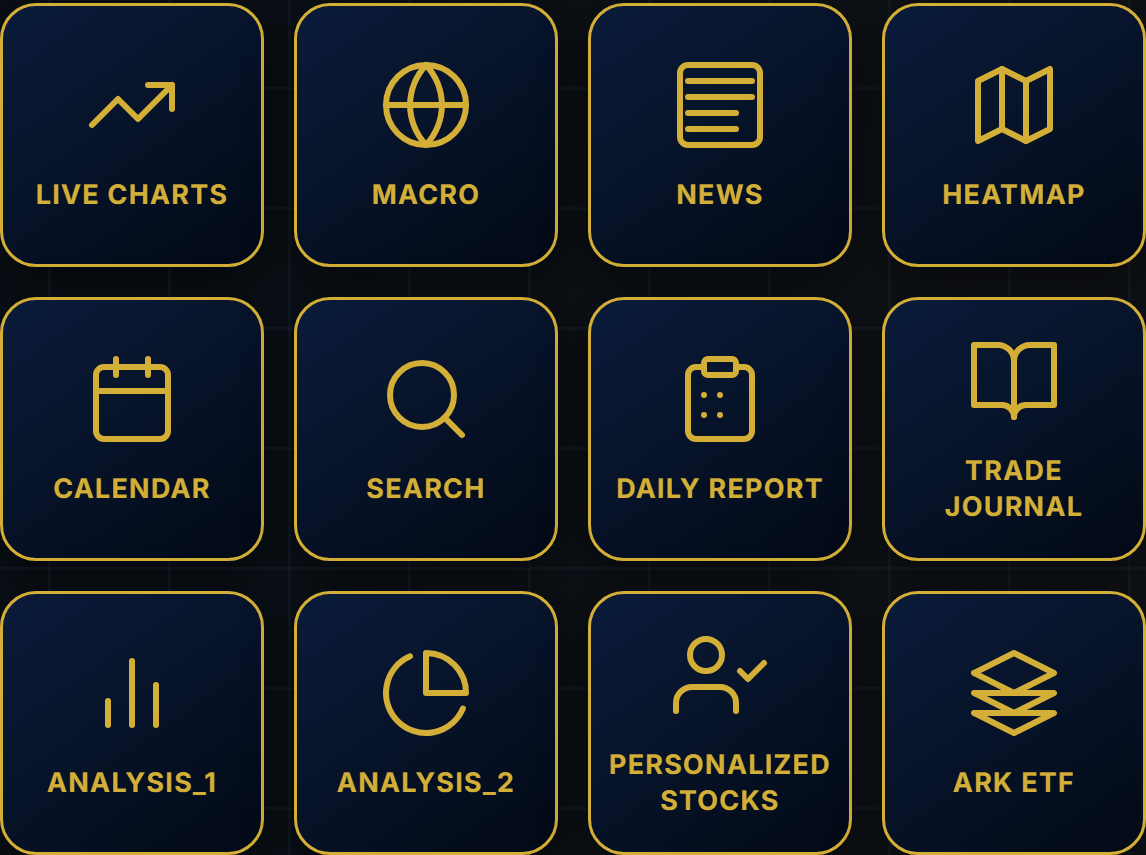
Live capture of Dashboard in Inveflo.
1) TL;DR
This framework converts Deep Dive metrics into one action: buy now, wait, or skip. It matters because most losses come from entries with no score confirmation. Use it when a ticker looks attractive but the entry timing is unclear.
2) Hook (Pain-Driven)
Most traders miss high-quality entries because they scan too late or trust one metric in isolation. I built this after repeatedly missing early breakouts while manually reviewing 300+ symbols.
3) Problem
PE can look cheap while growth decelerates. Momentum can look strong while participation is weak. Without a unified rule set, you cannot confidently answer: Should I buy now?
4) Solution (Widget Introduction)
Open ANALYSIS_1 and run Single-Stock Deep Dive. Combine stock-level quality with Composite Market Score (0-100), ExplosiveScore, and Catalyst Surge Score (CSS).
5) Logic Breakdown (Formula + Thresholds)
- Buy Candidate: EntryScore ≥ 78, ExplosiveScore ≥ 85, Composite Market Score ≥ 60
- Watch: EntryScore 65-77 or factor conflict
- Skip: EntryScore < 65 or Composite Market Score < 45
- Breakout Confirmation: Volume Surge Ratio > 1.5
6) Practical Use (IF X → THEN Y)
- If ExplosiveScore > 85 and Volume Surge Ratio > 1.5, then stage entries over 2-3 tranches.
- If CSS declines for 2 sessions while price rises, then wait for re-acceleration.
- If Composite Market Score falls below 50, then reduce size and prioritize capital protection.
Should I buy now? Only when score, regime, and participation align. Is this signal strong? Strong means high ExplosiveScore with confirmation. What should I do next? Execute staged entries or keep waiting.
7) Common Mistakes
- Treating Deep Dive as a standalone buy signal
- Ignoring regime context from Composite Market Score
- Entering before Volume Surge Ratio confirms participation
This is not a standalone buy signal and requires trend confirmation plus risk controls.
Frequently Asked Questions
What does ExplosiveScore measure and why is it important for entries?
ExplosiveScore (0-100) measures the likelihood a stock will have a significant price move in the near term based on multiple factors including valuation compression, momentum, and market positioning. An ExplosiveScore above 85 indicates high conviction opportunity. It's critical because high scores with CSS confirmation significantly reduce false breakouts and improve entry quality.
How do I interpret the difference between Buy, Watch, and Skip signals?
Buy (EntryScore ≥78): Execute staged entries immediately, allocate 100% to this position. Watch (EntryScore 65-77): Monitor for 2-3 days, wait for score re-acceleration or Composite Market Score confirmation above 60. Skip (EntryScore <65): Do not enter; capital is better deployed in higher-conviction opportunities. Always pair with Composite Market Score >45 minimum.
What role does Composite Market Score play in Deep Dive decisions?
Composite Market Score (0-100) reflects overall market regime and participation breadth. A score above 60 creates a favorable backdrop for all entries; below 50 means reduce position size by 50% even if stock signals are strong. Never ignore regime: strong individual stocks fail in poor market conditions. Always check Composite Market Score before scaling into winners.
When should I exit a Deep Dive position based on the score?
Exit rules: (1) If CSS declines 2+ consecutive days while price is rising, exit 50% immediately. (2) If Composite Market Score falls below 45, exit entirely and move to defense. (3) If ExplosiveScore drops below 60 after entry, consider trimming 25-50%. (4) Always use Catalyst Surge Score decline as an early warning to tighten stops.
Related Posts
- #2 How to Interpret PE/PB, Growth, and Analyst Signals on One Screen Alpha Discovery
- #3 How to Narrow Deep Dive Results into Buy Candidates in 5 Steps Alpha Discovery
- #7 Breakout Radar: Understanding Signal Quality and Filtering Breakout Radar
CTA: Open Scanner and Find Opportunities
Scan the full S&P 500, compare quality and signal scores, and build your watch list before market open.